A Trading Journal Designed Specifically for the Australian Stock Exchange
Analyse Your Data and Improve Your Trading Performance
-

IN-DEPTH ANALYSIS
An extensive and powerful Filtering Tool allows you to thoroughly focus, review and analyse your data
-

TRADING JOURNAL
Build an accurate and detailed Trading Journal complete with Notes and Plotting Charts
-

DISCOVER YOUR TRADING EDGE
A vast and extensive array of Key Metrics allows you to carefully examine all aspects of your data
-

ASX SPECIFIC
Developed specifically for the Australian Stock Exchange to meet the ASX' unique style
-

COMPATIBLE WITH IRESS
Upload your End of Day raw data from any Iress Platform; ViewPoint and Iress Pro
-

BUILT WITH EXCEL 365
Built and run on Excel 365 to benefit from all the best of Excels' latest features
Testimonials
-
Alan McGrath, Professional Trader and Mentor
I randomly came across TraderPrint on Twitter during its' development phase. I saw much potential in the product, and reached out to the developer.
I was so impressed by their drive to build a high quality but affordable Trade Journal, that I was more than happy to provide feedback on the features professional traders need, in order to evaluate and grow their trading edge.
Their final product is excellent! It really is an Australian industry leader in my opinion, with a wide array of reporting tools and metrics for both intraday traders and those who trade longer time frames. I highly recommend TraderPrint!
-
twitter.com/alanmcg
-
Cygnet Proprietary Trading Firm ASX
TraderPrintPro is so easy to use, and yet gives the trader granular detail on all their trades. Using the stats that are generated, traders are able to identify exactly where they have edge so they're able to focus and size up on those trades that work, and avoid those that don't. Updating the data is quick and traders are able to generate dot plots on each of their trades really quickly, without having to enter additional data.
I'd highly recommend TraderPrint Pro to any ASX Trader that is serious about having a successful trading career.
-
Cygnet Trading - Perth, WA
www.cygnettrading.com.au
TraderPrint Pro
Collapsible content

DataDrop
• Quick and efficient data upload from any Iress platform
• No sorting or trimming raw data, simply paste and upload
• Manual data entry option
• Group Data by order number function to keep data amount to a minimun
With the need for sorting and trimming eliminated, the DataDrop function allows Raw Data from any Iress platform to be uploaded quickly and easily; simply paste and upload!
Data can also be manually entered via the convenient Manual Data Entry Form.
RawData
• Add Initial Margin for Open Trades
Keep track of your Initial Margin for Open Trades.
TradeLog
• For closed positions
• Tag trades with the assistance of a drop-down menu
• Customise and create personal tags
• Analyse data in a tabular format
Use Pre-set Tags, or Create Your Own, to classify, label and define which elements make up your unique Trading Style.
Data is visually presented in a Tabular Format to allow quick, clear and simple analysis of your individual trades.
OpenTrades
· Monitor all open positions on one page
· Show open profit/loss, scale-out profit/loss, and your overall profit/loss which includes open, scale-out and closed positions
· Display exposure vs initial margin
· Use the ‘look up code price’ or ‘get end of day code price’ tools to manually add security close prices
Open Trades are easily accessed and displayed on one single page.
Open Trade summaries allow you to track your progress including Profit/Loss metrics and Exposure vs Initial Margin values.
Useful Price Check tools allow you to access online information quickly and efficiently.
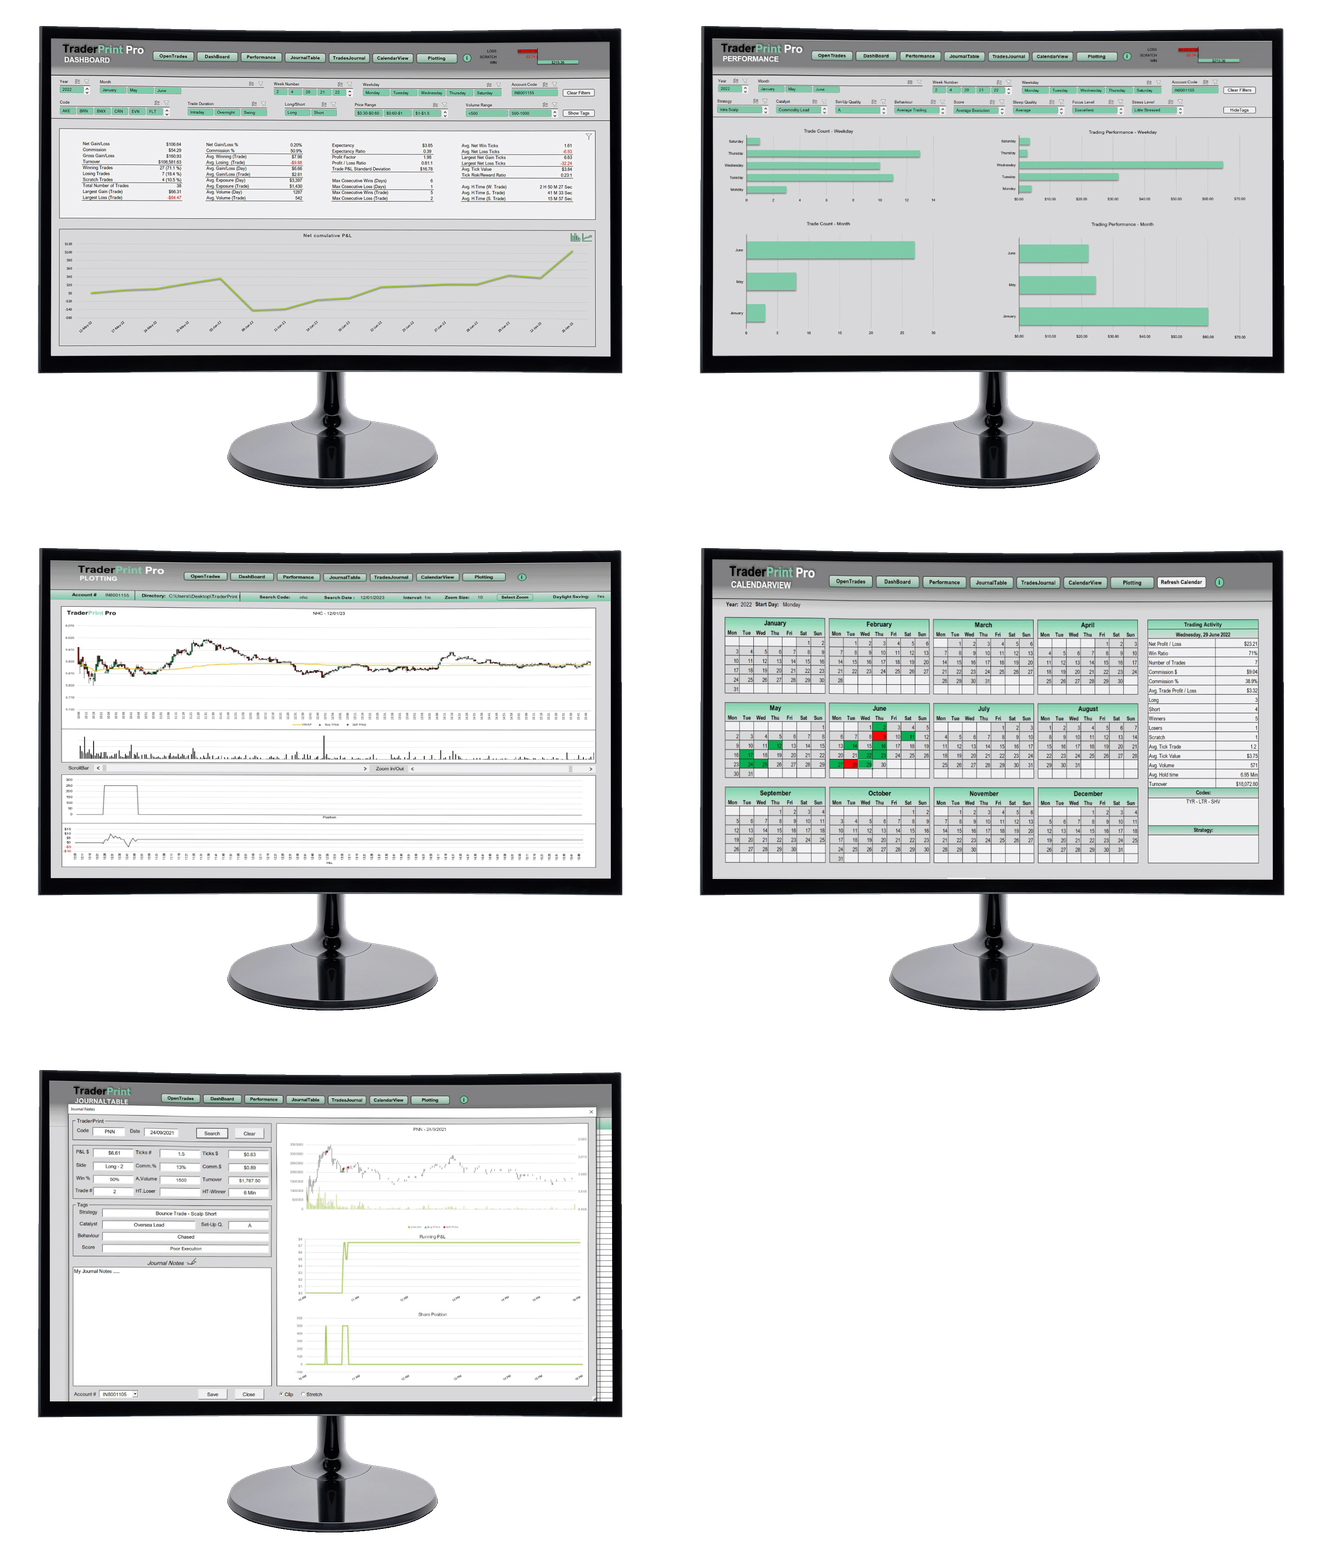
DashBoard
• Extensive filter selection to section and analyse data
• Vast array of key metric values
• Data visually presented with dynamic charts
All you need to know about your Trades is now at the tip of your fingers!
An extensive and powerful Filtering Tool allows you to thoroughly focus, review and analyse your data.
The vast array of Key Metrics allows you to carefully examine all aspects of your data.
Choose your preference between Bar or Line Charts to visually examine your data; track your Cumulative P&L, discover your Top and Bottom performing Stocks, and your Best and Worst Single Trades by Code.
Performance
• Trading data broken down into practical and informative aspects
• Visually presented to best analyse specific performance characteristics
• Discover insights into count and performance values
The heart of TraderPrint lies in its’ extensive and powerful Filtering Tool, which includes the ability to filter Pre-set or Customised Tags.
Narrow in on specific aspects of your trading; thoroughly focus, review and analyse your data.
Review your Count and Performance values over multiple aspects.
Your Personal Trading Data is visually broken down to fully understand where, when and how successful your performances are.
CalendarView
• Dynamic calendar displays green and red days
• Summary of trading activity for each day
The Dynamic Calendar effectively displays your Profit/Loss Days through using Green and Red colouring to visually represent your performance.
Clicking on one of the Green or Red markers will provide a Trading Activity Summary for that day including the ASX Stocks traded and which Strategies were implemented.
JournalTable
• Comprehensive details of daily trades summarised by code
• Analyse data in a tabular format
Daily Trades, including multiple Trade Counts, are summarised by their Stock Code and visually presented in a Tabular format to allow quick, clear and simple
analysis of your overall performance.
TradesJournal
• Build an accurate and detailed Trading Journal
• Search and display any closed trade
• Create journal notes
• Insert plotting charts
A Daily Summary of trades per ASX Code are quick and easy to display when using the search by Code and Date functions in the convenient TradesJournal.
Create Journal Notes while saved Plotting Charts are auto-populated to create a complete and detailed summary of your performance.
Plotting
• Plot Intraday Trades
• Save plots as .jpg file
• Populate One-Minute Chart with the 'Upload Data from File' or 'Get Stock Data' function to scrape from the web.
Visually display your Daily Summary of trades per ASX Code through Plotting Charts.
See your Entry and Exit points mapped out on the One-Minute Data Chart. Track your running P&L and Share Position.
Saved Plots are automatically inserted when entering your TradesJournal.
Week-Month
• Visualise your Weekly-Monthly data in a table format
• Monthly metrics comparison
• Cummulative Profit/Loss chart
• Filter your data by trade type or direction
The Week-Month page will show your data in a table format, listing your performance for each day of the week and month of the year, with the addition of a cummulative Profit/Loss chart to visualise your performance.
The page also have two monthly metric comparissons.
Become A Better Trader
A Trading Journal is an essential tool in becoming a better Trader.
Analysing our data and ourselves; our behaviours, habits, and how we react in different situations, offers us powerful insight into our performances.
A good Trading Journal is a tool for self-development. It should keep us constructive, keep us learning, and keep us working on the things that are most meaningful. They play a critical role in becoming a better trader.
That is why it is so important to keep a Trading Journal.


